
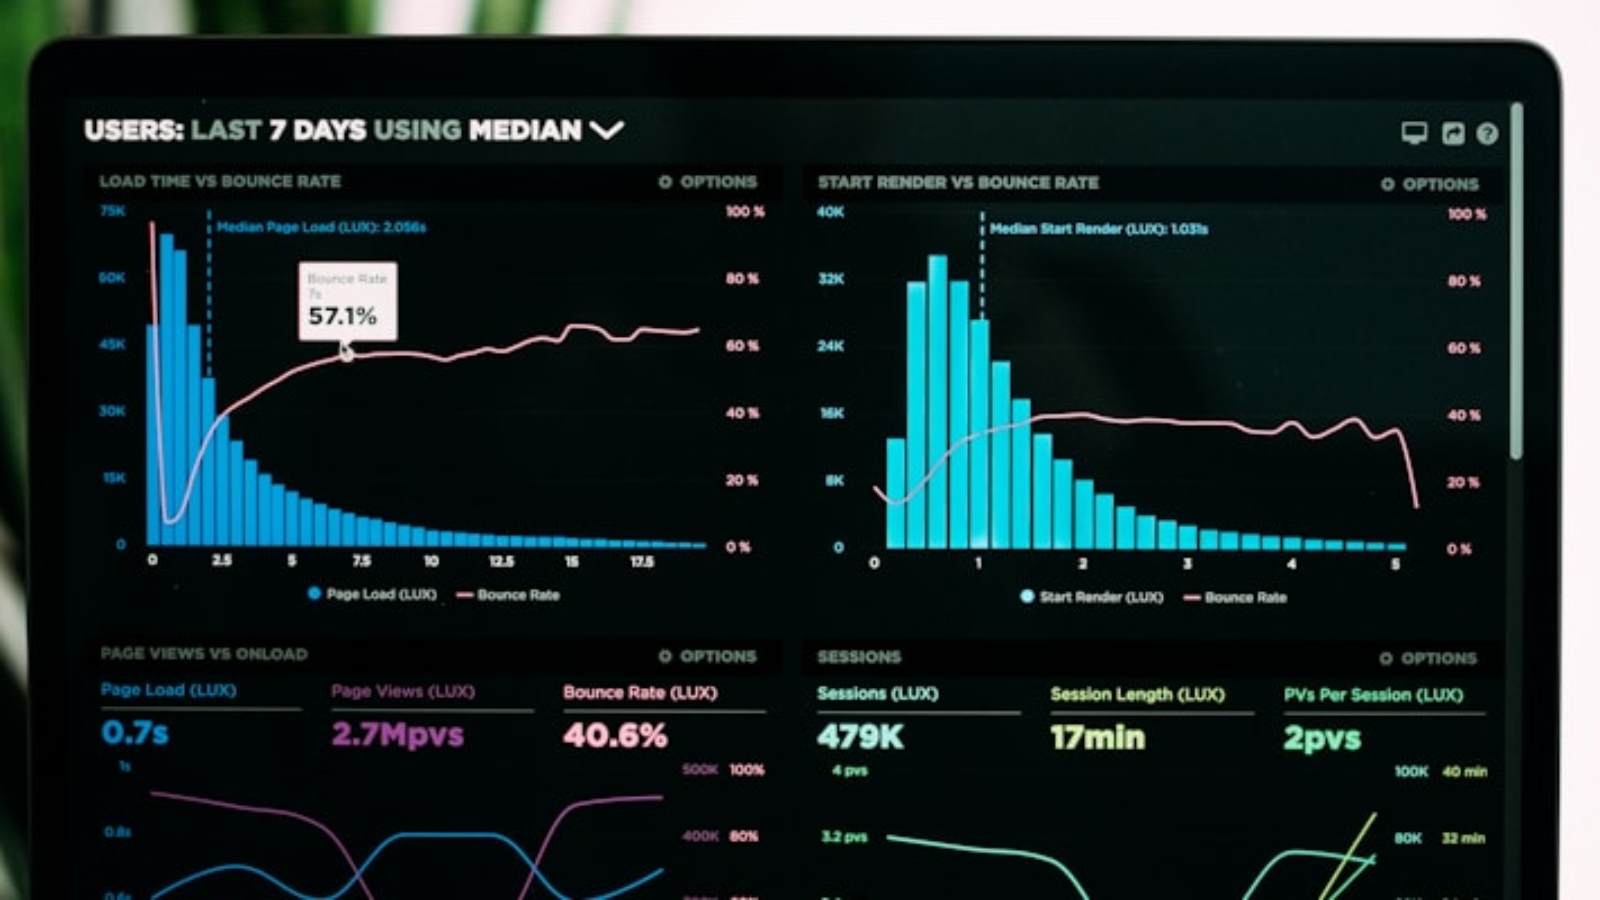
The Strategic Importance of Effective Data Visualization
In an era of data abundance, the ability to transform raw information into actionable insights determines competitive advantage. Power BI, Microsoft’s leading business intelligence platform, provides powerful tools for data visualization—but tools alone don’t create value. Effective dashboard design requires understanding both the technical capabilities and the principles of visual communication.
Research shows that well-designed dashboards can reduce decision-making time by 70% and improve data comprehension by over 80%. Conversely, poorly designed dashboards waste resources, create confusion, and can lead to incorrect business decisions.
Foundational Principles of Dashboard Design
Know Your Audience and Purpose
Before creating any visualization, answer fundamental questions:
Who Will Use This Dashboard?
- Executive leadership requires high-level KPIs and trend indicators
- Operational managers need detailed metrics and drill-down capabilities
- Analysts want comprehensive data access for ad-hoc investigation
- External stakeholders may need simplified, branded presentations
What Decisions Will This Support?
- Strategic decisions require trend analysis and comparative metrics
- Operational decisions need real-time or near-real-time data
- Compliance reporting requires precise values and audit trails
- Performance management needs clear targets and variance indicators
How Will Users Access the Dashboard?
- Desktop users can work with more complex, detailed visualizations
- Mobile users need simplified layouts optimized for small screens
- Embedded scenarios may have specific integration requirements
The Story Framework
Effective dashboards tell stories. Apply narrative structure:
Context: What situation does the audience need to understand? Provide reference points including targets, historical baselines, and industry benchmarks.
Conflict: What problems or opportunities does the data reveal? Highlight variances, anomalies, and trends requiring attention.
Resolution: What actions should result from the insights? Design pathways from insight to action through drill-downs and linked reports.
Visual Design Principles
Simplicity and Clarity
The most effective visualizations communicate their message instantly:
Eliminate Chart Junk: Remove decorative elements that don’t convey information—3D effects, excessive gridlines, redundant legends, and unnecessary borders. Every pixel should serve a purpose.
Maximize Data-Ink Ratio: Following Edward Tufte’s principle, maximize the proportion of ink devoted to presenting data. Reduce non-data ink including backgrounds, boxes, and decorative elements.
Use White Space Strategically: Adequate spacing between elements improves comprehension and reduces visual fatigue. Resist the urge to fill every available space.
Color Theory for Data Visualization
Color is among the most powerful—and most frequently misused—tools in dashboard design:
Establish a Color Hierarchy:
- Primary color for the most important metrics or series
- Secondary colors for supporting information
- Neutral colors (grays) for backgrounds and less important elements
- Alert colors (red, amber, green) reserved exclusively for status indicators
Ensure Accessibility:
- Approximately 8% of men have some form of color blindness
- Never rely on color alone to convey meaning
- Test visualizations with color blindness simulation tools
- Use patterns or icons alongside color coding
Maintain Consistency:
- Same data categories should have the same colors across all visualizations
- Establish and document a color palette for organizational use
- Consider cultural color associations when designing for global audiences
Typography Best Practices
Text elements require careful attention:
Font Selection:
- Use sans-serif fonts (Segoe UI, Arial) for screen readability
- Limit to two font families maximum
- Ensure sufficient contrast against backgrounds
Text Hierarchy:
- Dashboard title: 18-24pt
- Section headers: 14-16pt
- Chart titles: 12-14pt
- Data labels: 10-12pt (minimum for readability)
Label Optimization:
- Abbreviate intelligently while maintaining clarity
- Use consistent number formatting (decimals, thousands separators)
- Position labels to minimize eye movement
Choosing the Right Visualization Types
Time Series Data
Line Charts: Best for showing trends over continuous time periods. Use when:
- Comparing multiple series over the same time period
- Displaying rates of change
- Identifying patterns, seasonality, or anomalies
Area Charts: Similar to line charts but emphasize volume. Use when:
- Showing cumulative totals over time
- Displaying part-to-whole relationships that change over time
- Creating visual impact for important metrics
Categorical Comparisons
Bar Charts (Horizontal): Excellent for comparing categories. Use when:
- Category names are long
- Comparing many categories (10+)
- Ranking items by value
Column Charts (Vertical): Similar to bar charts with different orientation. Use when:
- Comparing fewer categories
- Time is on the horizontal axis
- Emphasizing height as a metaphor for quantity
Part-to-Whole Relationships
Pie Charts: Use sparingly and only when:
- Showing simple proportions with 5 or fewer categories
- Percentages sum to 100%
- Approximate comparisons are sufficient
Treemaps: Better alternative for complex hierarchies. Use when:
- Displaying hierarchical data with multiple levels
- Comparing many categories simultaneously
- Size and color can encode different dimensions
Distribution Analysis
Histograms: Show frequency distribution across ranges. Use when:
- Understanding how data is distributed
- Identifying outliers or unusual patterns
- Comparing distributions across groups
Box Plots: Display statistical distribution summaries. Use when:
- Showing median, quartiles, and outliers
- Comparing distributions across many groups
- Statistical precision matters more than visual appeal
Relationships and Correlations
Scatter Plots: Reveal relationships between two variables. Use when:
- Exploring correlations
- Identifying clusters or outliers
- Each point represents a distinct entity
Bubble Charts: Extend scatter plots with a third dimension (size). Use when:
- Three variables need simultaneous visualization
- Relative magnitude matters alongside position
Key Performance Indicators
Card Visuals: Display single important numbers prominently. Use when:
- Highlighting key metrics
- Providing at-a-glance status information
- Creating visual focal points
Gauges: Show progress toward targets. Use when:
- Current value relative to goal is important
- Red/yellow/green status zones are meaningful
- Target achievement drives behavior
Performance Optimization
Data Model Efficiency
Dashboard performance begins with data model design:
Star Schema Architecture: Organize data into fact tables (measurements) and dimension tables (descriptive attributes). This pattern optimizes both query performance and DAX calculation efficiency.
Aggregation Tables: Pre-aggregate data for common analysis levels. Power BI’s aggregation feature automatically routes queries to the appropriate level.
Incremental Refresh: For large datasets, configure incremental refresh to update only recent data rather than reprocessing everything.
Report-Level Optimization
Limit Visuals Per Page: Each visual requires queries and rendering. Keep pages focused with 6-8 visuals maximum.
Avoid Calculated Columns: Prefer measures over calculated columns. Measures calculate at query time and don’t consume storage.
Use Variables in DAX: Variables improve both readability and performance by calculating expressions once and reusing results.
Interactive Features
Filtering and Slicing
Enable users to explore data while maintaining context:
Slicer Best Practices:
- Position slicers consistently across pages
- Use dropdown slicers for many values
- Implement “Select All” defaults for exploratory analysis
- Consider sync slicers for consistent filtering across pages
Cross-Filtering: Configure visual interactions thoughtfully:
- Some visualizations should filter others
- Some should highlight while maintaining full context
- Some should remain independent
Drill-Through and Drill-Down
Enable progressive disclosure of detail:
Drill-Through Pages: Create detail pages accessible from summary visuals. Users right-click to navigate while maintaining filter context.
Hierarchy Drill-Down: Design hierarchies (Year → Quarter → Month → Day) enabling users to explore patterns at multiple granularities.
Bookmarks and Navigation
Guide users through complex analyses:
Scenario Bookmarks: Save filter and slicer states for common analysis scenarios. Users can switch between views with a single click.
Page Navigation: Create custom navigation experiences using buttons and bookmarks. Guide users through analytical stories.
Mobile Design Considerations
Design for users who access dashboards on phones and tablets:
Mobile Layout View: Create dedicated mobile layouts that prioritize the most important information for small screens.
Touch Optimization: Ensure interactive elements are large enough for touch interaction (minimum 44×44 pixels).
Reduced Complexity: Mobile views typically work best with fewer, larger visuals rather than dense desktop layouts.
Testing and Iteration
User Testing
Validate designs with actual users:
Think-Aloud Testing: Ask users to verbalize their thought process while using the dashboard. Identify confusion points and workflow inefficiencies.
Task Completion: Measure how long users take to answer specific questions using the dashboard.
Feedback Collection: Establish mechanisms for ongoing user feedback and enhancement requests.
Performance Testing
Test with realistic data volumes:
Load Testing: Verify acceptable performance with expected concurrent user counts.
Refresh Testing: Ensure data refresh completes within acceptable timeframes.
Cross-Platform Testing: Test on all platforms (desktop, web, mobile) that users will access.
Conclusion: From Data to Decisions
Exceptional Power BI dashboards combine technical excellence with design thinking. They respect users’ time and cognitive load while providing the insights needed for effective decision-making.
Remember that dashboard design is iterative. Start with a minimum viable product, gather feedback, and continuously refine. The best dashboards evolve based on user needs and changing business requirements.
Invest in dashboard design as a strategic capability. The organizations that communicate data effectively will make better decisions, respond faster to market changes, and ultimately outperform competitors still struggling with information overload.
Add a Comment